
Teams usually search for Hotjar alternatives for one of two reasons.
The first reason is cost or packaging. The team wants heatmaps and session recordings, but the plan shape starts to feel awkward as traffic, sites, teammates, or filters grow.
The second reason is more important: heatmaps and recordings helped the team notice a problem, but they did not give enough context to fix it.
A heatmap can show that people tap the wrong part of a screen. A recording can show one person getting stuck. That is useful. But product teams need to know whether the same behavior repeats across a cohort, whether it affects conversion or retention, whether the issue is mobile-specific, whether an API request failed, and whether engineering can reproduce it.
The best Hotjar alternative is not merely another heatmap tool. It is a workflow that connects visual behavior to replay, journeys, product analytics, rage clicks, crashes, performance, and technical context.
What people really mean by Hotjar alternatives
"Hotjar alternatives" sounds like a simple software comparison query. In practice, it contains a few different jobs:
| Search intent | What the team is probably trying to solve |
|---|---|
| hotjar alternatives | Find a behavior analytics tool with a better fit for the team. |
| hotjar competitors | Compare vendors before committing to a product analytics stack. |
| alternative hotjar | Replace heatmaps and recordings without losing the qualitative workflow. |
| session replay tools | Watch real sessions and understand what happened before a user dropped. |
| behavior analytics tools | Combine qualitative behavior with measurable product patterns. |
| website heatmap google analytics | Add visual context to analytics data that does not show where users struggled. |
| mobile session replay | Bring the same replay habit to apps, gestures, crashes, and device context. |
The important part is not the exact phrase. The important part is the gap underneath it.
Analytics tells the team that a checkout step loses people. A heatmap tells the team that attention clusters around the wrong area. A replay tells the team what the person actually saw. Journey analytics shows whether that moment is part of a larger path. Stability and API context show whether the product failed technically.
That full chain is what teams should evaluate.
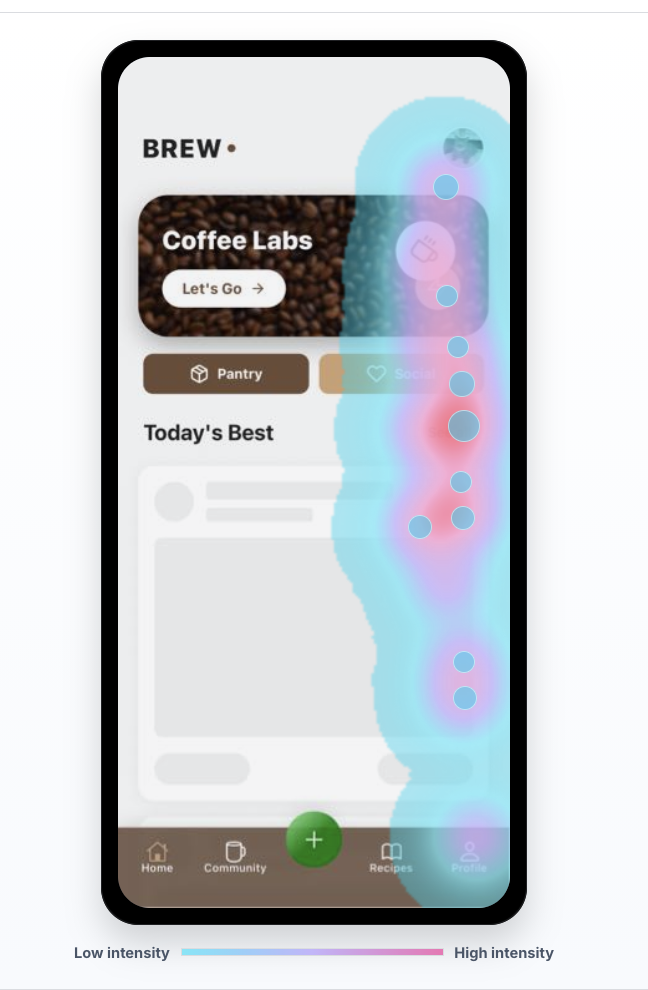
Heatmaps show attention, not intent
Heatmaps are useful because they compress thousands of interactions into one visual summary. You can see where users click, tap, scroll, hesitate, and ignore a region. This is especially helpful when a screen has competing calls to action or when a mobile UI makes an important target hard to reach.
But a heatmap does not explain intent by itself.
A hot area can mean:
- Users are interested.
- Users are confused.
- Users are tapping a dead element.
- Users are trying to dismiss something.
- Users are repeatedly tapping because the first touch gave no feedback.
- Users are fighting layout shift, latency, or a broken request.
Those possibilities lead to different fixes. If the user is interested, the team might make the CTA stronger. If the user is confused, the team might simplify the screen. If the user is rage tapping, the team might need to fix responsiveness, validation, or an invisible disabled state.
The heatmap points at the room. Replay opens the door.
Recordings need product and technical context
Session recordings are the obvious next layer. Watch the session. See the page. See the taps. See the pause before the user leaves.
That is much better than arguing from a chart, but recordings can become their own trap. If a team watches five random recordings, it may overfit to the weirdest clip. If it watches a single session without product context, it may fix a symptom that barely affects the business. If support watches one recording and engineering cannot inspect the technical context, the investigation still has a handoff problem.
The better workflow is:
- Start from a measurable pattern.
- Open the sessions behind that pattern.
- Watch the actual product moments.
- Tag the repeated friction.
- Check journeys, heatmaps, crashes, API calls, and device context.
- Ship the smallest fix.
- Verify the same cohort improves.
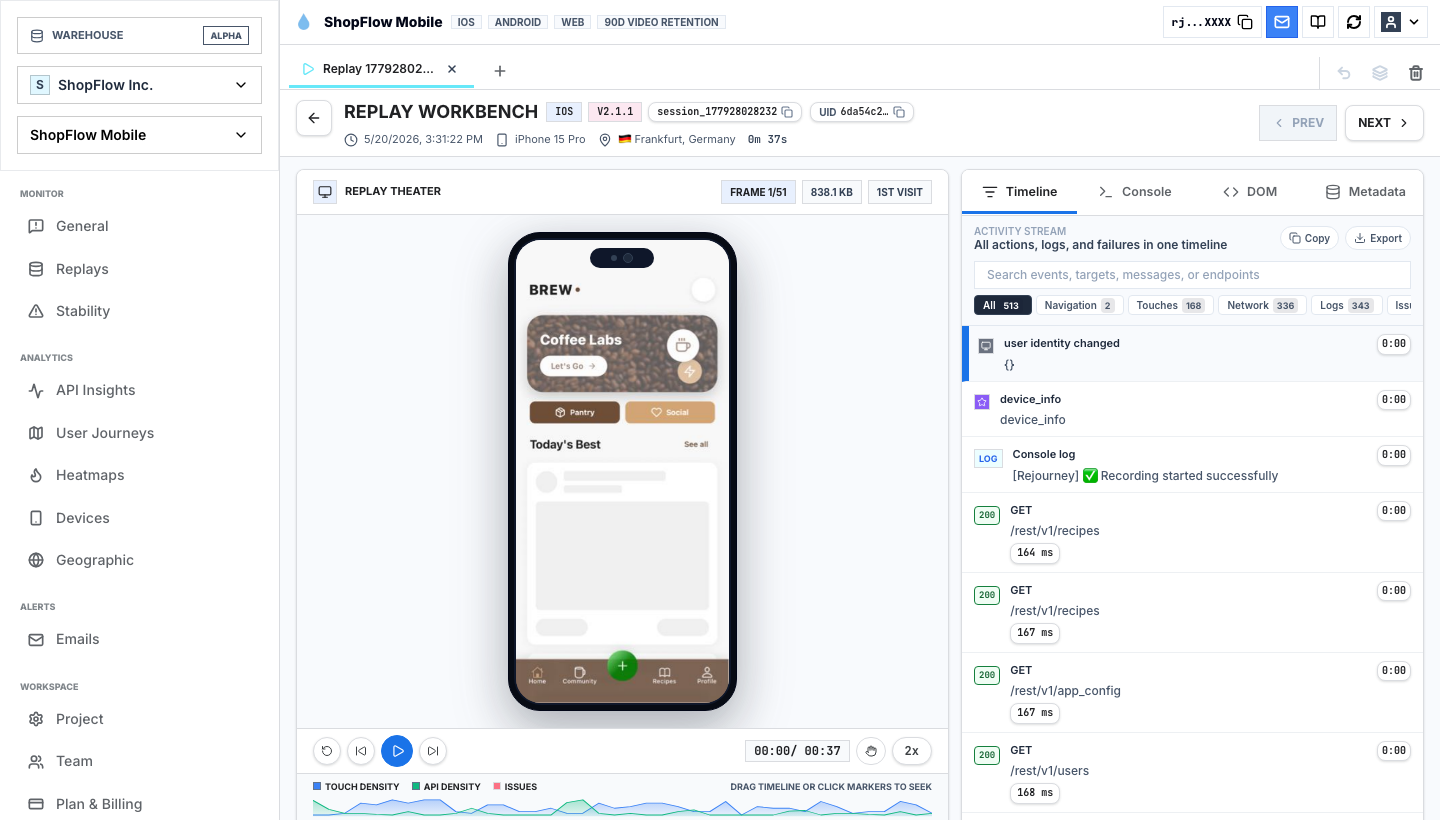
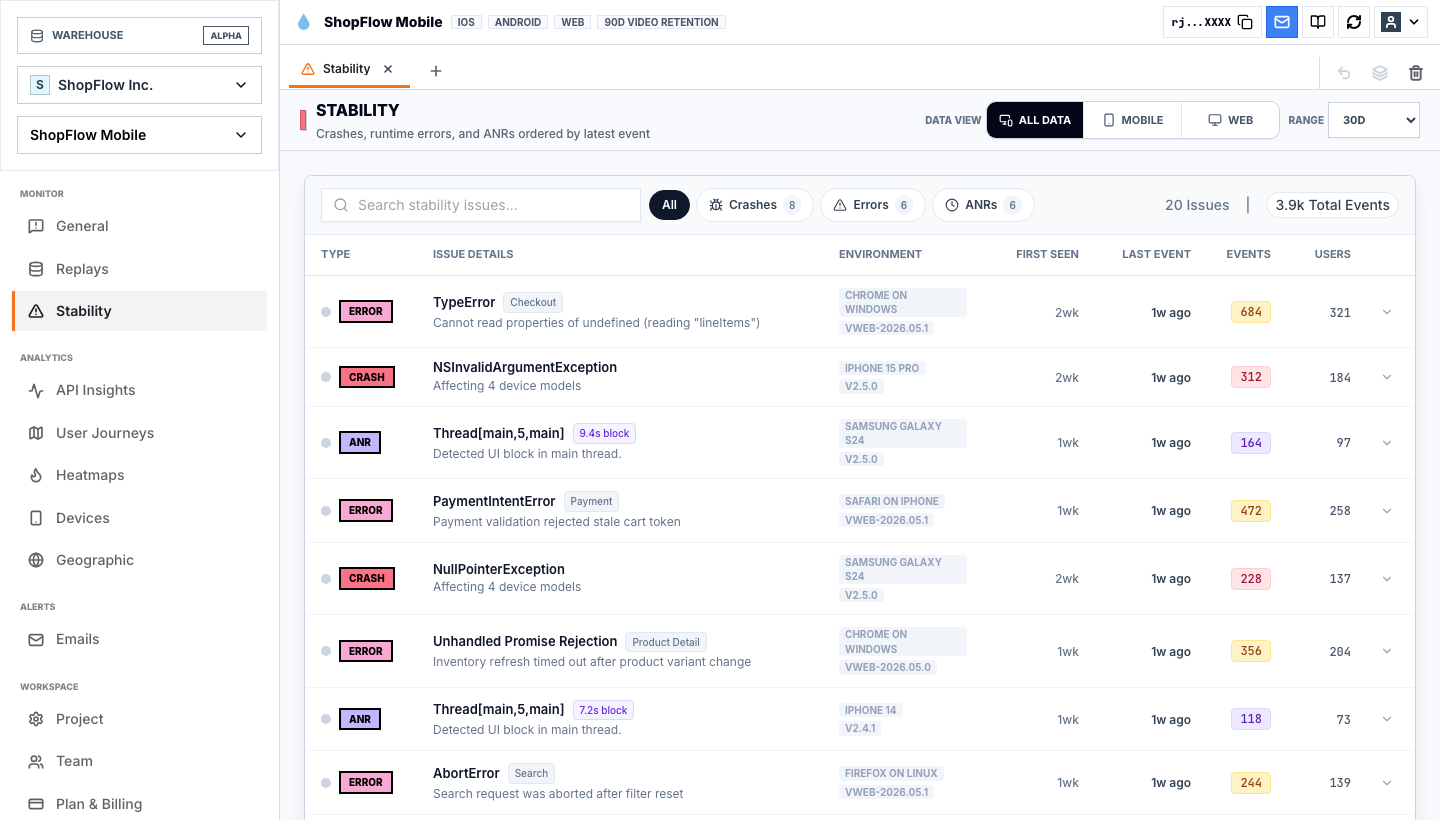
In the replay view, the session is not isolated from the rest of the product. The timeline, activity stream, API density, touch density, issues, device context, and replay are close together. That matters because the question is rarely "can we watch a user?" The useful question is "can we explain this user's behavior well enough to decide what to fix?"
Journey analytics turns clips into paths
A single recording is a story. A journey map is the pattern behind many stories.
This is where many heatmap-first tools start to feel thin. A product team does not only need to know that users touched a pricing card. It needs to know how those users arrived, where they went next, whether they returned to search, whether they looped through reviews, whether they reached cart, and whether the path differed between new and returning users.
For example:
- If users go Home -> Product Detail -> Cart, the screen might be working.
- If users go Home -> Product Detail -> Reviews -> Size Guide -> Wishlist, the screen may be creating doubt.
- If users go Home -> Search -> Product Detail -> Search again, product discovery may be weak.
- If users go Product Detail -> Cart -> Product Detail repeatedly, pricing, shipping, or trust signals may be unclear.
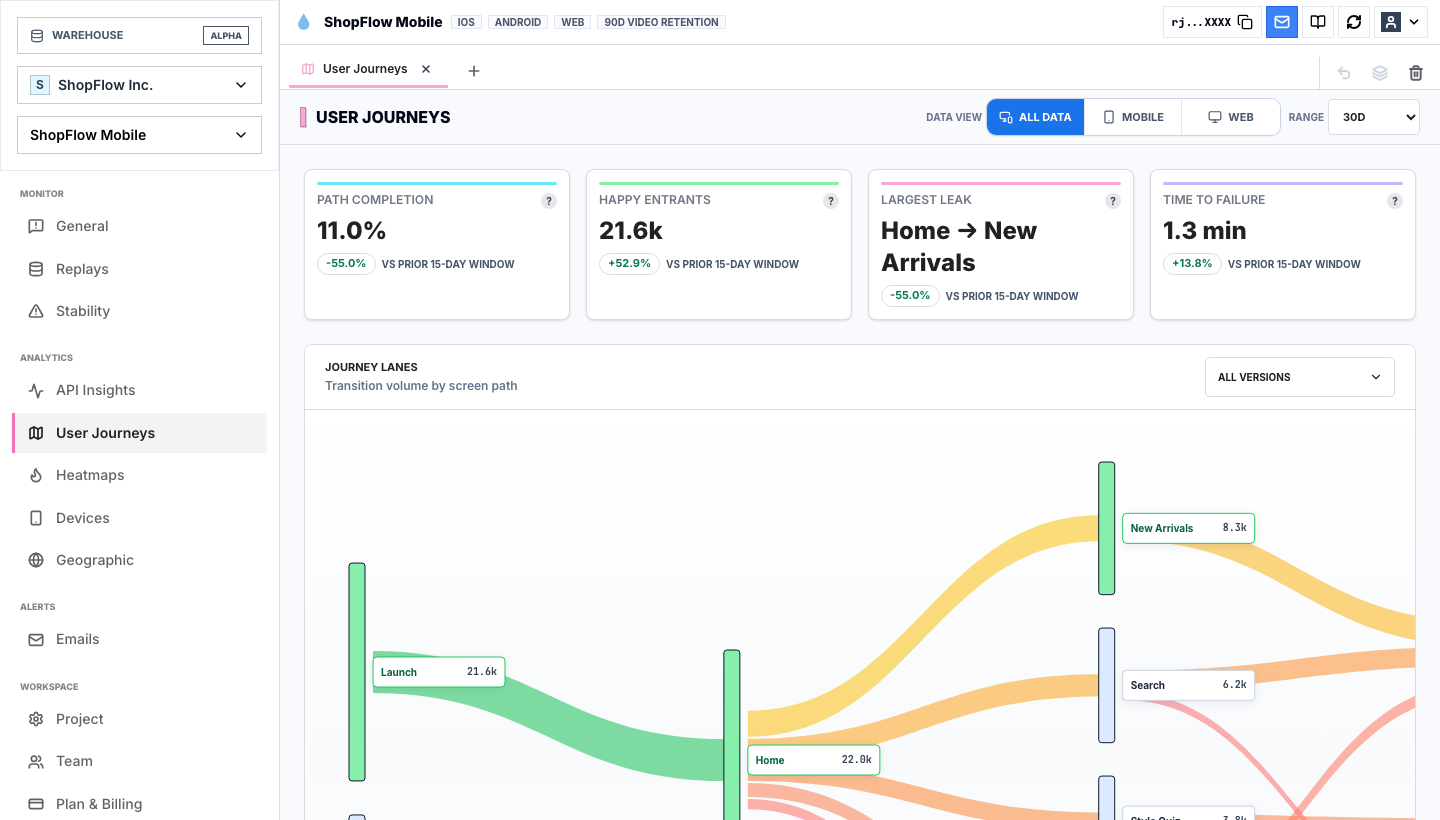
Journey analytics is the bridge between qualitative and quantitative work. It keeps the team from treating one replay as universal truth, and it keeps funnels from becoming sterile event math.
When evaluating Hotjar competitors, ask whether the product can move from a visual symptom to the surrounding journey. If it cannot, the team will still need another analytics tool to understand whether the session mattered.
Product analytics makes the behavior measurable
A good alternative to Hotjar should also answer the product analytics question: how often does this happen, and who does it affect?
That means the tool should help the team segment by:
- New users versus returning users.
- Acquisition source.
- Browser, device, OS, app version, or geography.
- Route, screen, or feature.
- Rage clicks, dead taps, crashes, API errors, or slow requests.
- Conversion and retention outcomes.
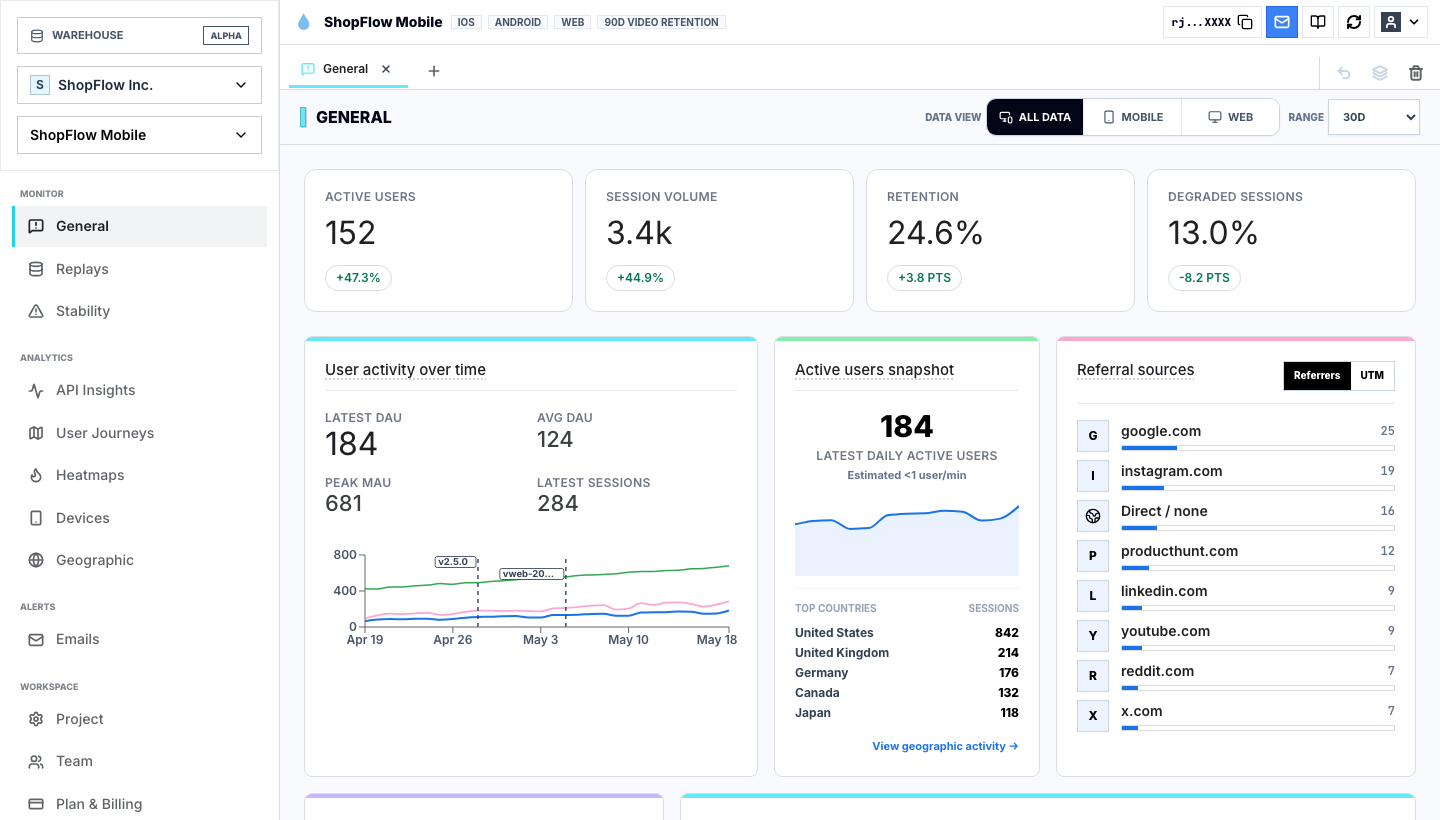
This matters because heatmaps can make everything feel urgent. A glowing hotspot looks important even when it belongs to a tiny group. Product analytics helps the team decide whether the behavior is a product risk, a support edge case, or a curiosity.
The strongest workflow is not "look at a heatmap and guess." It is "find a pattern, watch the evidence, measure the affected cohort, then ship a fix."
Mobile changes the evaluation
Many teams start with website heatmaps and browser recordings, then discover that the more painful problems live in mobile apps.
Mobile adds context that web-only behavior analytics tools often struggle to capture:
- Taps, swipes, and gesture density.
- Screen transitions.
- App version differences.
- Device model and OS behavior.
- Native crashes and ANRs.
- API timing and failed requests.
- Offline or degraded network behavior.
If your product is mobile-first, mobile session replay is not a nice add-on. It is the actual evidence layer.
This is also where "Hotjar alternative" becomes the wrong frame. The question is not only who has heatmaps. The question is who can show what happened when a real app user hit friction on a real device.
Technical friction still looks like UX friction
Users do not know whether a problem came from design, frontend code, backend latency, a third-party API, or a mobile runtime issue. They only know the product felt broken.
That is why behavior analytics should sit close to stability context.
A rage click might be a bad button. It might also be a slow API. A checkout abandonment might be confusing copy. It might also be a payment validation error. A drop-off after signup might be weak onboarding. It might also be a crash on one device model.
If product and engineering investigate in separate tools, the team loses time translating the issue. A replay-first workflow keeps the evidence together so the team can ask better questions sooner.
A practical checklist for choosing a Hotjar alternative
Use this checklist before picking a behavior analytics tool:
| Evaluation question | Why it matters |
|---|---|
| Can we watch the exact session behind a metric? | Prevents analytics-only guessing. |
| Can we see heatmaps and replay together? | Turns visual attention into inspectable evidence. |
| Can we map the journey before and after the moment? | Shows whether the issue is part of a larger path. |
| Can we segment by cohort, source, device, and version? | Prevents one interesting recording from becoming a false priority. |
| Can we detect rage clicks, dead taps, errors, crashes, or ANRs? | Separates curiosity from friction. |
| Can support, product, design, and engineering share the same evidence? | Reduces handoff loss. |
| Can the workflow support mobile apps, not only websites? | Matters for teams whose product experience lives in iOS, Android, React Native, or Expo. |
| Can pricing tolerate deeper instrumentation? | Teams should not avoid useful events because the bill punishes detail. |
For many marketing sites, a classic heatmap and recording tool may be enough. For product teams, especially teams building web apps and mobile apps, the bar is higher.
Where Rejourney fits
Rejourney is a Hotjar alternative for teams that want replay-first analytics rather than a heatmap-only workflow.
The goal is not to replace qualitative insight with more dashboards. The goal is to connect the qualitative and quantitative layers:
- Heatmaps show where attention and friction concentrate.
- Session replay shows the exact moment.
- Journey analytics shows the path around the moment.
- Product analytics shows how often it happens.
- Stability and API context show whether the product failed technically.
- Team-wide access keeps support, product, design, and engineering in the same evidence trail.
That is the difference between collecting recordings and repairing product friction.
If the team is comparing Hotjar alternatives, the best next step is not another feature grid. Pick one important flow, such as signup, checkout, onboarding, search, pricing, or subscription cancellation. Then ask which tool can show the metric, the heatmap, the session, the journey, and the technical context without forcing the team to stitch the story together by hand.
That is where a replay-first product becomes useful.
For the shorter vendor comparison, see Rejourney vs Hotjar.